
Gnuplot and Matplotlib Plots#
Switching between Gnuplot and/or Matplotlib#
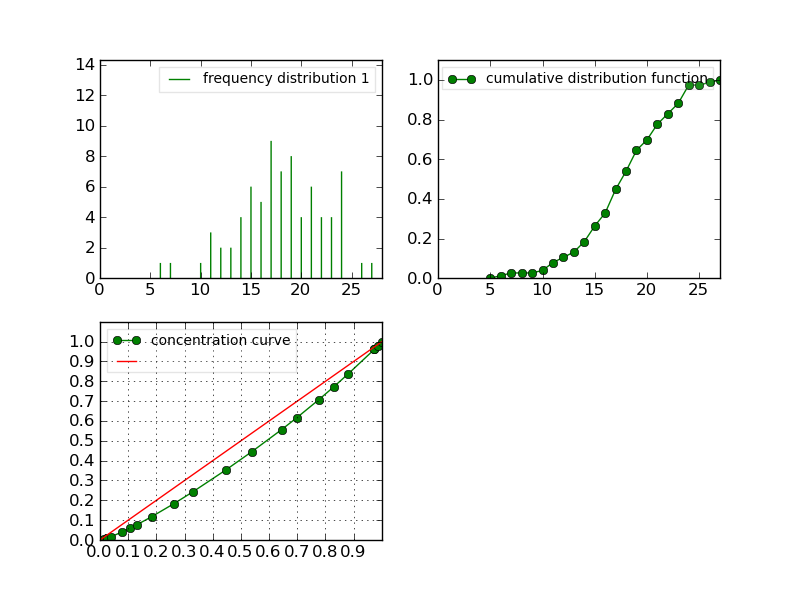
>>> h1 = Histogram('./test/data/meri1.his')
old AML style
h.old_plot()
new style, either with GNUPLOT or MATPLOTLIB. By default, matplotlib is used if it is implemented:
>>> clf()
>>> h1.plot(show=False)
>>> savefig('doc/user/stat_tool_histogram_plot.png')
>>> # by default, the Plot routine uses matplolib (if available)
>>> # but you can still use gnuplot
>>> plot.set_plotter(plot.gnuplot())
>>> # and come back to matplotlib later on
>>> plot.set_plotter(plot.mtplotlib())
Saving in postscript with gnuplot#
There are other methods related to GNUPLOT (if implemented to output the results in a file or ps file)
>>> h1.plot_write('output', 'title')
>>> h1.plot_print() # save gnuplot output in a postscript file